Back to All Guides
GET IN TOUCH
If you would like to get further information about Frog or help in getting it set up in your school please get in touch via the contact details below...
hello@frogeducation.com
Reporting
The Reporting application you can choose to run a number of reports based upon a selection of parameters defined within Frog.
The aim of this guide is to introduce you to:
- Navigating Reporting
- Settings
- School Reports
- Group LO Progress
- LO Data Export
- Phase of Curriculum
- Student Progress by Subject
- Student Progress by Period
- Student Progress Summary
Navigating Reporting
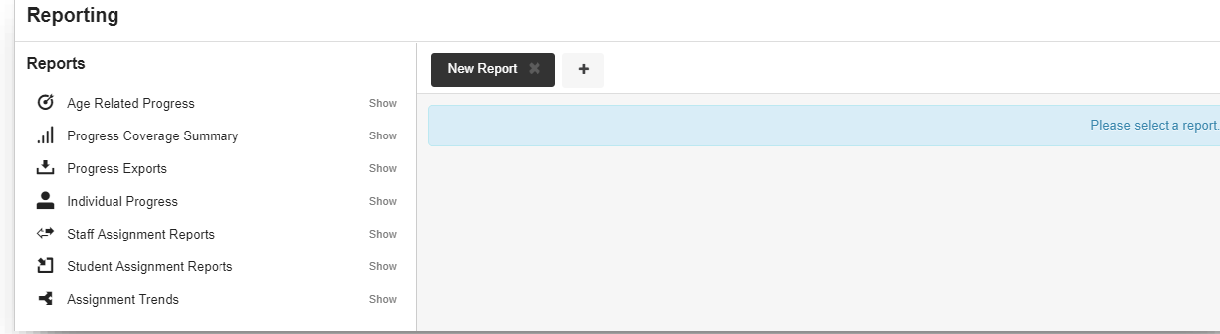
The Reporting application is a powerful reporting tool designed to make it easy to extract information on students quickly. There are six reports currently pre-programmed into the Reporting application.
The Reporting application can be accessed from Quick launch, the Quick links dashboard or from the Applications section of FrogDrive.
When the Reporting application first opens you will be presented with a list of available reports on the left hand side. The page will display a New report section which will invite you to select a report to run. To run a report, choose one from the left hand menu and the page will show you the parameters for that report.
Your newly created chart will then be visible in your My charts area of the Progression charts application.
Settings
New report tab - Use the + button to create new tabs to run new reports. This will allow you to quickly and easily refer to multiple reports without having to run a new set of parameters each time.
Menu - The reports menu can open and collapse to save space. Look for these arrows to open and close the menu panel.
Action cog - For all reports that display within the platform, an Action cog can be used. This gives the option to print the selected report
Parameters arrow - The parameters arrow will collapse the parameters window, making it much easier to see the report content, or to quickly adjust the parameters.
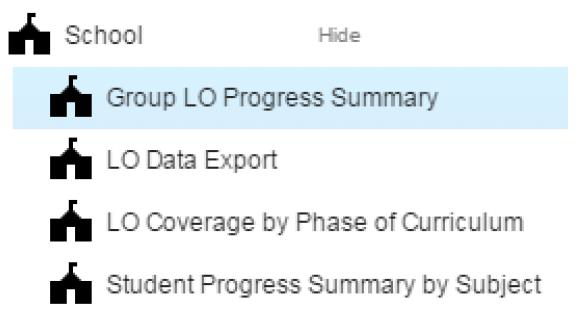
School Reports
The School reports section contains reports that apply to groups of students. These reports could be run for class groups, year groups, or for the entire student profile.
Group LO Progress
The Group LO progress summary report provides a report for a specific subject, group and phase of the curriculum. It is grouped by learning objective within a specified assessment period.
- Select group - Use this predictive field to type the name of the group you wish to report on
- Select curriculum - Use the Please select button to choose the area of the curriculum you wish to report on
- Select reporting period - Use the drop down boxes to choose your assessment period. The report will pull through all data up until the selected period
- Filter by KPI's - This report provides the option to view all data or just the data for KPIs
- View report - Use the blue View report button to view the report.
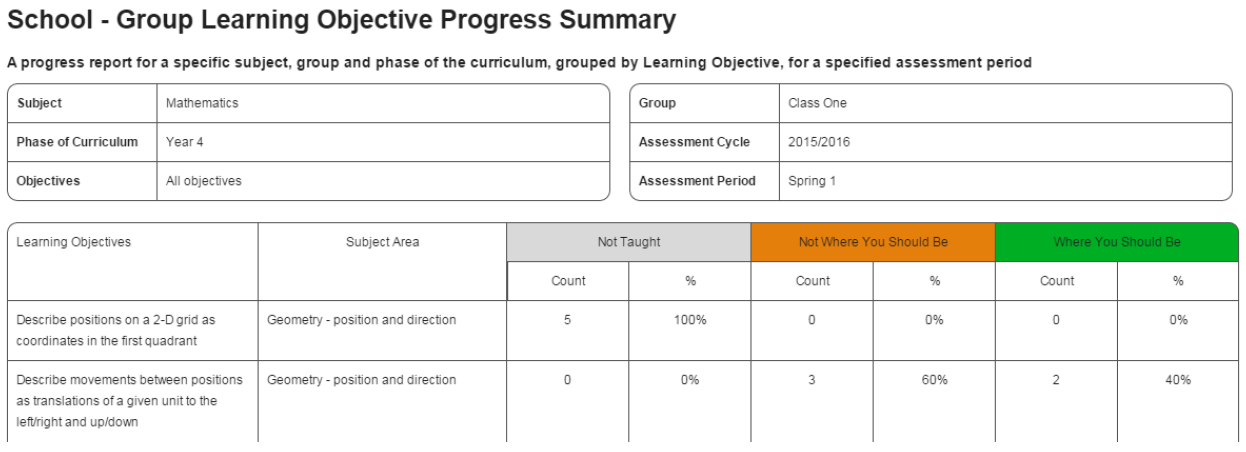
This report provides both a count and % of the learning objectives at each status. If you wish to manipulate this data further, we recommend copying the content into an Excel spreadsheet or similar.
LO Data Export
The LO data export will export all information requested from it within the selected parameters. It is possible to run this export without setting any parameters, but we would generally recommend that at least the Reporting cycle and the Curriculum or Group fields are selected, if only to make the resulting export easier to handle.
Parameters
- Select student or group - Use the predictive drop down to find an individual or group
- Select curriculum - Use the Please Select button to find the area of the curriculum you wish to report on
- Select reporting cycle start - Use the drop down to configure when you would like the reporting data to start from
- Select reporting cycle end - Use the drop down to configure when you would like the reporting data to end
- Filter judgements - If multiple judgements have been set against students in the time period selected, you can choose to export all of these judgements, or just the most recent. As we will see later, there can be benefits to only exporting the most recent
- Filter by KPI's - Do you need to see all objectives for your selected student/group/curriculum? If you are reporting against the KPI's for that particular parameter you can choose the KPI's only radio button to reduce the data you will pull out
- Download report - Use the download report to pull out the report into a CSV file. This file can be opened in Excel and manipulated, saved or printed as required.
Phase of Curriculum
The LO coverage by phase of curriculum report provides a summary of coverage of learning objectives taught for a subject and group over an assessment cycle and period. The LO coverage by phase of curriculum report can show data for prior and next phase of the curriculum.
Parameters
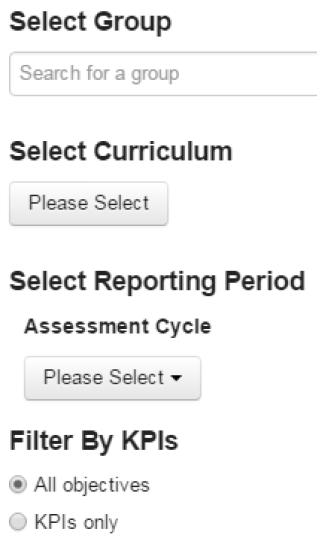
Select group - Use this predictive field to type in the name of the group you wish to run the report for
Select curriculum - Use the Please select button to choose the area of the curriculum you wish to track against
Include prior phase of curriculum? - Do you want to see data for the prior phase of the curriculum you have selected?
Include next phase of curriculum? - Do you want to see data for the next phase of the curriculum you have selected?
Select reporting period - Select the reporting period you wish to view data for
Filter by KPI's - Do you wish to see data for all learning objectives or just for KPI's?
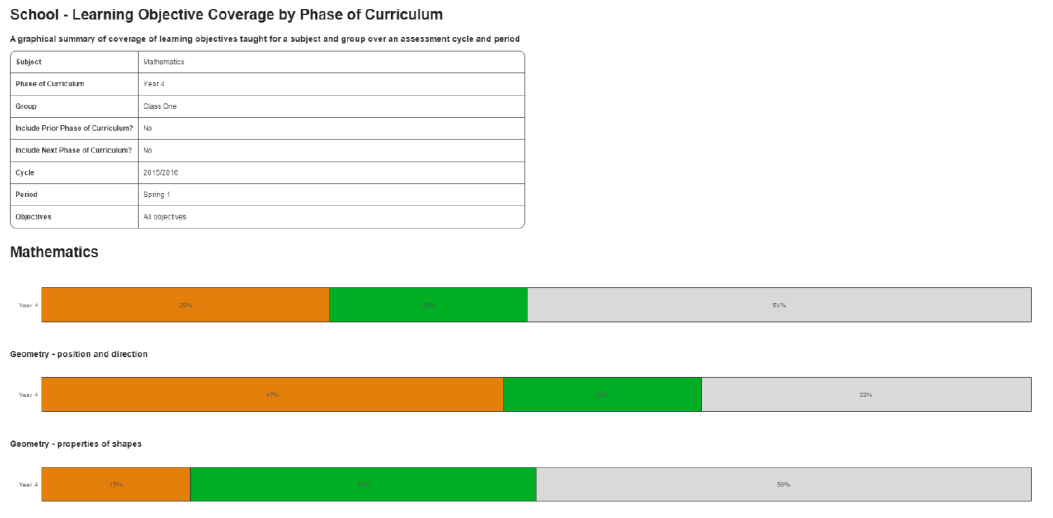
The report splits the subject chosen down into its subject areas to give a broad stroke summary of the coverage of learning objectives taught for this subject and group. The grey bar shows objectives which have not yet been covered.
Student Progress by Subject
The Student progress summary by subject report provides student summaries by assessment status for a subject up to the end of a specified assessment period.
Parameters
Select group - Use this predictive field to type in the name of the group you wish to run the report for
Select curriculum - Use the Please select button to choose the area of the curriculum you wish to track against
Select reporting period - Select the reporting period you wish to view data for
Filter by KPI's - Do you wish to see data for all learning objectives or just for KPI's?
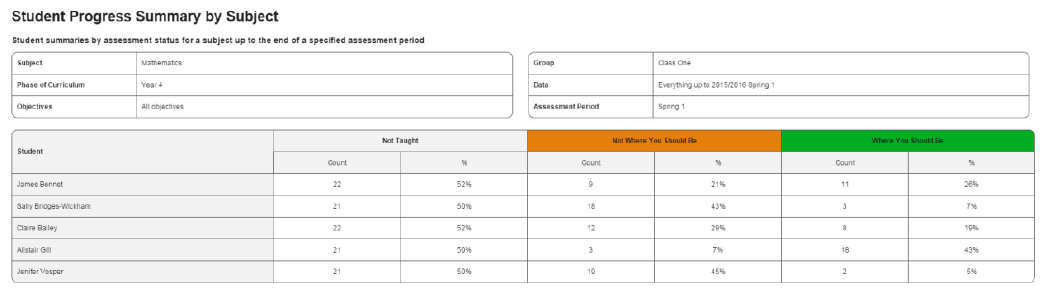
The report provides both a count (the amount of) and % (the overall percentage of) learning objectives at each status. With this report, as with the Group LO progress summary, if you wish to manipulate this data we recommend copying the content of the report into an Excel spreadsheet or similar.
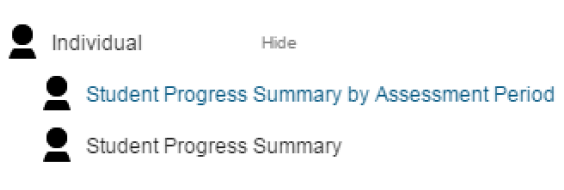
Individual reports
The Individual reports section contains reports which can be run for individual students. These reports are designed for use with parents, or to track students of particular interest or concern.
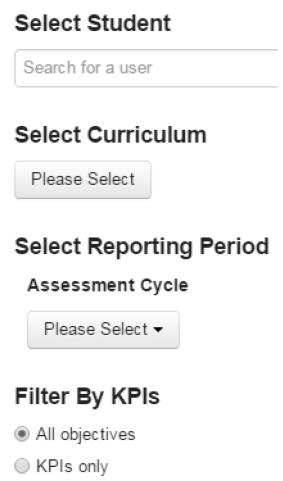
Student Progress by Period
The Student progress summary by period report gives detail of all the objectives the selected student has been assessed against in each assessment period within a selected cycle, subject and year of the curriculum.
Parameters
Select student - Use the predictive field to search for a student
Select curriculum - Use the Please select button to choose the area of the curriculum you wish to track against
Select reporting period - Select the reporting period you wish to view data for
Filter by KPI's - Do you wish to see data for all learning objectives or just for KPI's?
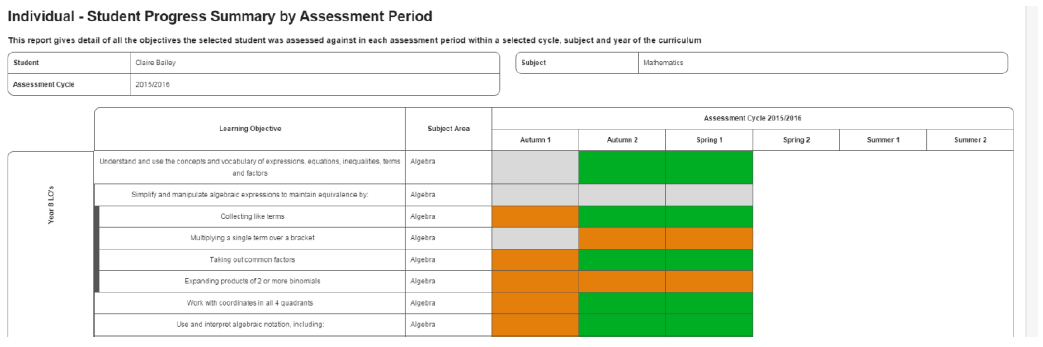
This report will list the learning objectives down the left hand side with the assessment cycles and periods on the right. The corresponding squares will be marked to show which assessment status has been set against each objective or KPI.
Child objectives will be shown with a dark grey line down the left hand side, directly under their parent objective.
Future periods will be shown in white and non-assessed periods will be shown in grey.
As this report is run for an individual student in a particular subject, all objectives assessed in that subject will be displayed regardless of the year group they are separated into. This means that if a child/student is working either above or below age expected levels, you will be able to see their progress across all objectives using this report.
Student Proogress Summary
The Student progress summary provides a graphical progress summary for a specific student within a subject, measuring learning objectives over a selected assessment cycle. This report provides a line graph and a bar graph.
Parameters
Select student - Use the predictive field to search for a student
Compare with group - Use the predictive field to choose a group to compare the student against. This could be their class or year
Select curriculum - Use the Please select button to choose the area of the curriculum you wish to track against
Select reporting period - Select the reporting period you wish to view data for
Include class average? - Do you want to include the class average data for the group you have selected?
Filter by KPI's - Do you wish to see data for all learning objectives or just for KPI's?
Target
Progress first works out how many objectives have been taught to the class at that point in time. Progress then multiplies the number of KPI's that have been taught by the value of the target status to give the current target score. This is then converted in to a % by dividing the current target score by the maximum*** number of points as per the target.
Actual
Total number of points (based upon the value of each assessment status) that the student has accumulated at that point in time. This is then converted in to a % based upon the number of points accumulated/the maximum*** number of points as per the target.
Class average (Optional)
The total number of points (based upon the value of each assessment status) that each student has accumulated at that point in time; divided by the number of students. Converted in to a % based upon the average number of points accumulated/the maximum*** number of points as per the target. *** Maximum = total number of objectives x value of target status.
Progress data in excel
Using the data provided by the LO data export and the data analysing tools available in Excel together can yield some powerful opportunities for data analysis.