Back to All Guides
GET IN TOUCH
If you would like to get further information about Frog or help in getting it set up in your school please get in touch via the contact details below...
hello@frogeducation.com
Analytics
Frog provides the application Analytics, dedicated to providing a high level analysis of the activity on your Frog platform.
About Analytics
Frog Learn provides the application Analytics, dedicated to providing a high level analysis of the activity on your Frog platform.
In short, it allows users to answer the question, “How much is my Frog platform being used?”
The Analytics application is only available to Admin profile users, though it is possible to allow other users to have access by changing the application policy for the relevant profile, group or user.
By default, the Analytics application is accessible from the Quick launch menu, though you can search for it in the global search or browse to it by using FrogDrive and going to the Applications section.
Analytics is made up of a number of sections;
- Dashboard
- Sites
- Assignments
- Users.
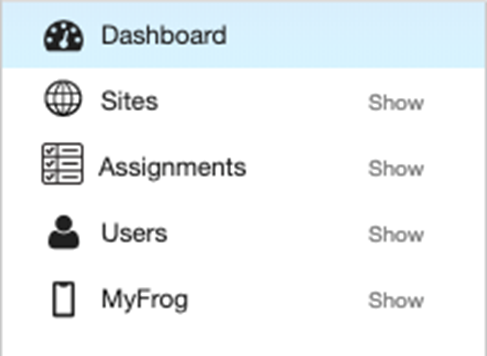
Each section gives detailed information on how that area is being utilised in Frog.
Dashboard
The Analytics area of the Frog platform captures information related to the use of the platform by end users covering areas such as user logins, site creation and assignments. The initial Dashboard view shows the number of user logins per day, the number of site visits and a summary of assignments. You can filter this information by profiles and you can choose whether to display the last 7 days or the last 30 days of information.
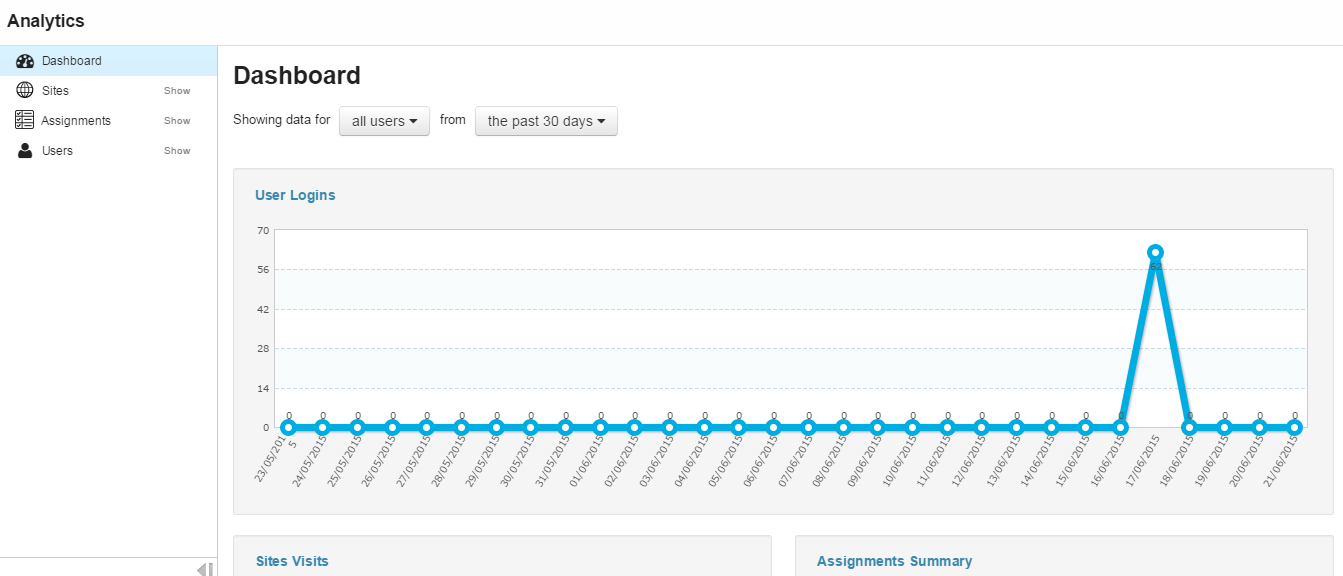
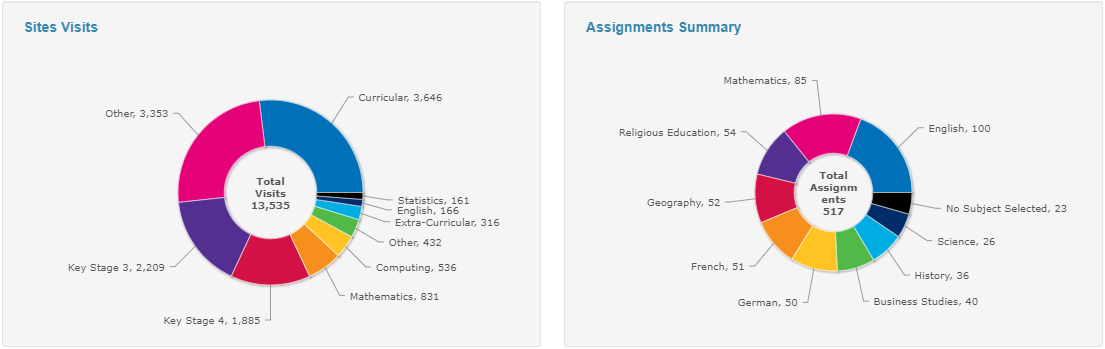
Below the user login information, you can see an overview of site visits and assignments summary.
Sites
The Sites category provides more detailed analytics covering the usage and creation of Frog sites.
All sites
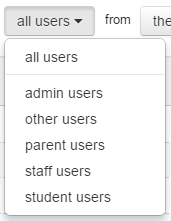
The All sites view can be further filtered using the User type drop down menu and the Date range drop down menu.
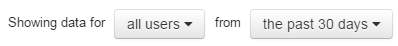
User type can be filtered by profile.

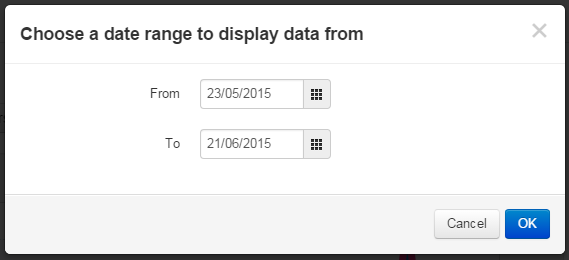
The date range for results can be set to the past 7 days, the past 30 days or a custom date range, selected using the Choose dates option.
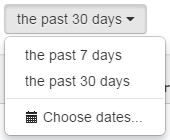
To choose a custom date range, select the Choose dates option followed by selecting a From and To date.

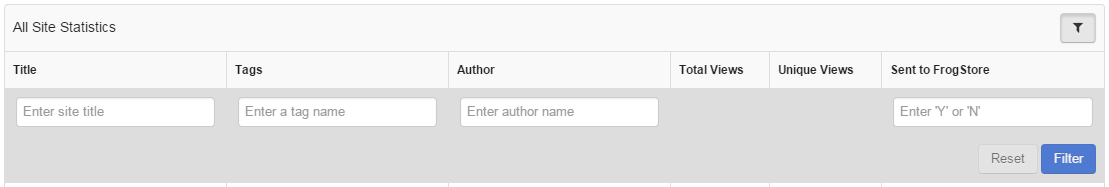
A tabular version of the data displayed in the chart can be found below the chart itself. This tabular data can be filtered using the Filter button in the top right hand corner.
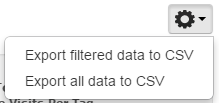
To export the data from the Analytics app, select the Action cog and choose whether you wish to download all the data or your filtered view.
Sites by tag
The Sites by tag view allows you to see the number of Frog sites, authors and views for a given tag within Frog Learn. This view might be helpful in identifying the key users of the platform as well as seeing areas that may not be creating Frog sites.
Sites by author
The Sites by author view allows you to see the numbers of Frog sites, tags used and view numbers for sites created by a specific author. This may be useful in identifying the champions of Frog in your school.
Assignments
The Assignments view allows you to see the number of assignments being created and set throughout Frog.
All assignments
The All assignments view shows all assignments throughout the platform. You can filter the view further using the User type drop down menu and the Date range drop down menu.

User type can be filtered.
The date range for results can be set to the past 7 days, the past 30 days or a custom date range, selected using the Choose dates option.

To choose a custom date range, select the choose dates option followed by selecting a From and To date.
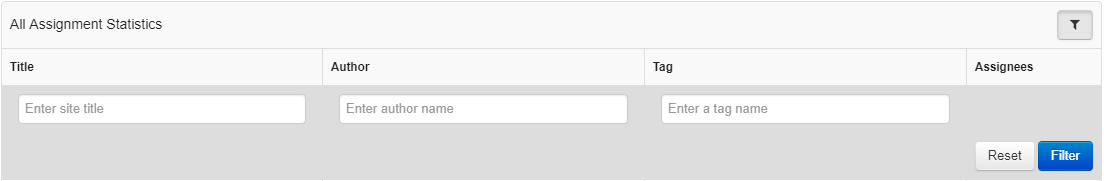
A tabular version of the data displayed in the chart can be found below the chart itself. This tabular data can be filtered using the Filter button.
To export the data from the Analytics app, select the Action cog and choose whether you wish to download all the data or your filtered view.

Assignments by tag
The Assignments by tag view allows you to see the number of assignments, assignment authors and assignees for a given tag within Frog Learn. This view might be helpful in identifying the key users of assignments within your platform.
Assignments by author
The Assignments by author view allows you to see the number of assignments being created by specific authors. Again you can see the total number of assignments by author, the number of unique tags and the number of assignees.
Users
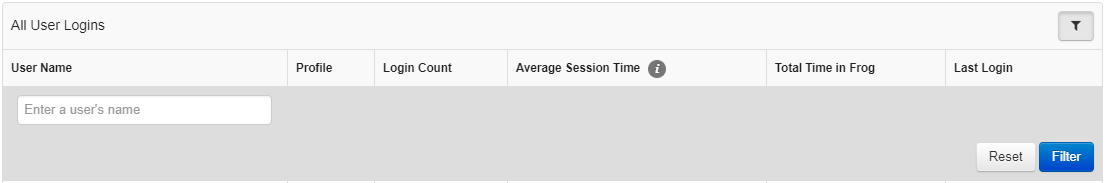
The All logins view shows global information on the users that are logging into the platform. Information includes the number of logins, average session times and the total time they have spent logged in. You can also see the date and time of their last login. You can filter the view further using the User type drop down menu and the Date range drop down menu.

User type can be filtered by the admin of staff profiles.

The date range for results can be set to the past 7 days, the past 30 days or a custom date range, selected using the Choose dates option.

To choose a custom date range, select the Choose dates option followed by selecting a From and To date.

A tabular version of the data displayed in the chart can be found below the chart itself. This tabular data can be filtered using the Filter button.
To export the data from the Analytics app, select the Action cog and choose whether you wish to download all the data or your filtered view.

Logins by profile
The Logins by profile view allows you to further filter the information surrounding Logins to the platform by user's profiles, displaying information collated by these profiles.